
hacker / welder / mechanic / carpenter / photographer / musician / writer / teacher / student
Musings of an Earth-bound carbon-based life form.
I’ve been thinking about building a nice PostgreSQL dashboard for some time now. Recently I ran across pgHero and I decided that, while pgHero looks awesome, installing Ruby and then having to deploy all the extra bits that go with it is a real drag. I’m a huge fan of the story around deployment of JVM applications; gripe all you want about the language but being able to deploy a fully-functional piece of software, including all of its dependencies, as a single JAR file to a host is a godsend. Deploying new versions of the app and all of its dependencies is as simple as rolling out a new JAR and then restarting the JVM. And the JVM is fast.
The other weekend I decided to take a stab at writing one using Dropwizard and D3.js, and the result is shaping up nicely as Kenshō, which is available under the Apache 2.0 license on GitHub. In its current form, Kenshō is designed to collect metrics every few seconds and record them using in-memory time-series datastructures from another project of mine, Shuzai, which has the goal of providing PANDAS-like functionality in the JVM using Java. This means that Kenshō can store millions of datapoints with very little memory usage and can then time-box and re-scale the data points using a variety of consolidation techniques, such as summation or mean, as needed to consolidate data into smaller time boxes.
Currently, Kenshō records query data for the database you are connected to including:
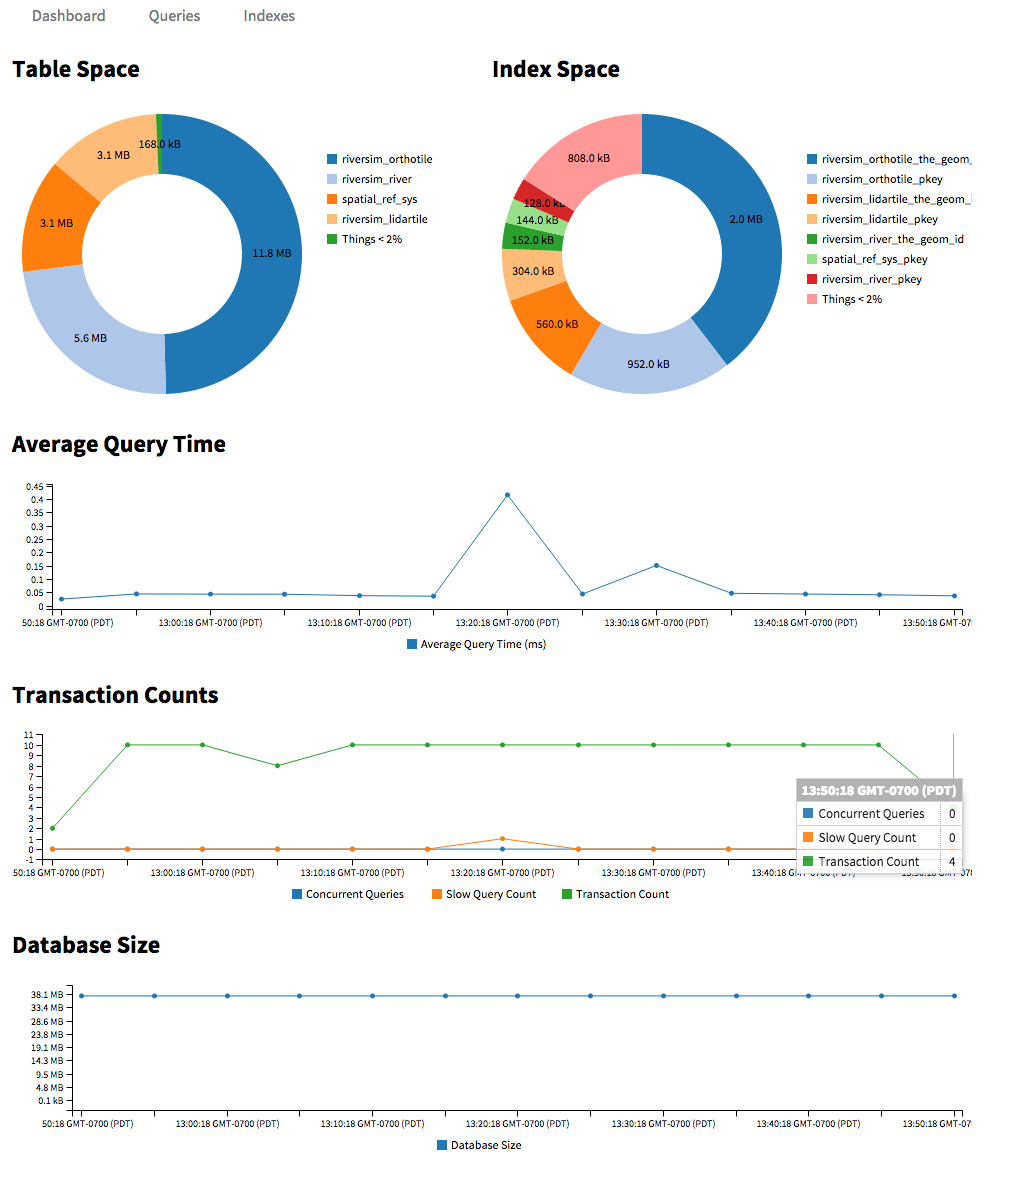
With Kenshō you can: view the size of your database over time; see how the space is being used by which tables; learn which tables are taking advantage of indexes, and which are not; identify queries with poor performance profiles; see the performance of a specific query over time; and see the overall health and activity of your database.
In the future I am planning to add:
If you are interested in hacking on Kenshō, feel free to open a GitHub issue or send me an email; the more help the better!